AMATEUR CCD PHOTOMETRY OF COMETS: HOW TO STANDARDISE
DATA
Mark R. Kidger
Instituto de Astrofísica de Canarias
A difficulty that observers face when taking
data of comets is how to standardise their data to make it compatible with
other observers using different instruments. The widespread use by amateurs of
CCD cameras of high sensitivity and good cosmetic quality enormously increases
the possibilities of photometric coverage of comets given that photometry is
calculated automatically with astrometric observations. Although the MPC
database now contains huge amounts of comet photometry, the lack of any
standard method for taking this data means that the dispersion in photometry of
a comet in the MPC database may be as large as 2 magnitudes at a given date
even for magnitudes given as "N". In this paper we explore a standard
system of photometry that is widely used by Spanish and Italian observers based
on the USNO A2.0 catalogue and a series of standard photometric apertures. The
suitability of the USNO catalogue for photometric work is examined critically
and examples of comet light curves and coma profiles are shown. A
transformation of USNO A2.0 to the standard Landolt BVR system is presented.
Introduction
Possibly the biggest revolution in cometary astronomy in the last 50 years has been the recent widespread use of CCDs by amateurs to take large quantities of high-precision astrometry of comets. In the last five years the use of CCD cameras with a sensitivity and cosmetic quality as high as those of the professional CCDs of the 1990s has led to a huge explosion in the amount of astrometry that has become available, both of comets and of asteroids. Amateur observers are regularly obtaining high-quality astrometry of objects down to magnitude 20, allowing precise orbit determination to be made within a few nights of the discovery of a new object. This revolution is reflected in the increasing size of the MPC database and also in the explosion in the number of site codes that have been asigned.
Most astrometric packages that are widely used,
both by amateurs and professionals, such as Astrometrica, provide not only an
accurate position for a comet or asteroid, but also calculate an estimated
magnitude. Thus the explosion in astrometry of comets has also led to a huge
explosion in the amount of CCD photometry potentially available.
Unfortunately, this photometry is difficult to understand and even more
difficult to use as it is obtained with a mishmash of apertures, methods and
bandpasses. This leads to the potentially fabulous resource of the amateur
cometary CCD photometry archive being massively underutilised.
The problem
Amateur CCD photometry is potentially an even more important resource for cometary research than astrometry however, to make it usable we have to find some way of standardising it. Any system that is adopted must obey three rules:
- Don’t make it too complicated.
If you do nobody will use the method.
This has happened with the ICQ format for CCD photometry which was so complicated and anti-intuitive that many astronomers complained that it stopped them submitting their data.
- Amateurs have limited time and
resources. Adapt the method to what they can do.
We must accept that an amateur astronomer works in his or her spare time and does not have the capability to spend many hours on adapting data. Any system must be rapidly and easily usable and should not require them to buy additional expensive equipment.
- Don’t be too demanding. Accept
a reasonable compromise on quality.
Any system will be a compromise
between the quantity and the quality of the data that is
obtained. It makes no sense to put in place a system that decreases the amount
of acceptable data by a large factor for only a small gain in quality.
Similarly, the data quality that is obtained must be high enough for the data
to be usable in research.
We must also work within some restrictions that, while possibly not to our taste, are facts of life that must be accepted:
- Most
amateurs do not have either standard astronomical filters, or a
significant fraction of photometric nights. It is no good demanding that
they use standard stars or a standard photometric system!
- Comets
are usually not point sources: they have their own special problems when
we take photometry of them. This means adapting the photometric routines
to take photometry in a different way to asteroids.
In other
words:
- Common sense says that we will
just have to accept unfiltered observations and relative photometry
against field stars. This has been a standard astronomical technique for
many years.
- We have to make the best of
what we have.
The basic “Spanish method”
CCD observers in Spain have been using a standard system of photometry of comets for several years. This system has been evolving with time to maximise its utility and efficiency. Data taken with this system has now been used in several photometric studies published in professional journals. A comparison of amateur results using this technique and dedicated professional photometry shows minimal differences in the values of Afr that are obtained (Kidger, 2004, A&A 420, 389, “Dust production and coma morphology of 67P/Churyumov-Gerasimenko during the 2002/2003 apparition II. A comparative study of dust production in 46P/Wirtanen and 67P/Churyumov-Gerasimenko during their 2002/2003 apparition” ).
The steps involved are
- Assume
that an unfiltered CCD observation approximates to the photometric “R”
band (usually a good assumption).
- Recommend
reducing with Astrometrica which has a good, robust photometric method and
gives a reliable estimate of the error.
- Take
a standard aperture for the photometry.
- Spanish
observers use 10”.
- This
is a sensible compromise between pixel size and seeing, as against
measurement errors.
- Calibrate
using USNO A2.0 “R” magnitudes.
More recently, a dedicated reduction routine prepared by Julio Castellano (MPC site code 939) has been prepared by a Spanish observer (FOCAS) that allows data to be obtained in multiple apertures (10, 20, 30, 40 and 60”, although for very large comas 150 and 300” may be used). One important aspect of FOCAS is the fact that it uses the median of the entire frame for sky background determination, rather than taking an annulus around the photometric aperture that causes coma to be subtracted from coma in extended objects.
However, given that most observers have urban
sites with high levels of light pollution, with the background as high as
magnitude 15 per square arcsecond, photometry becomes increasing unreliable due
to sky subtraction errors for larger apertures, particularly with fainter
comets. This often means that the best and most reliable photometry is obtained
with the 10” aperture as the amount of sky background within the aperture is
only a quarter of that in the 20” aperture.
The USNO catalogue and its reliability
Some astronomers criticise the use of USNO magnitudes for any photometric application, not specifically photometry of comets, alleging that it is not a photometric catalogue and that it is unreliable. Two recent USNO products are available: USNO A2.0, obtained from scanning POSS-I plates from the 1950s; and USNO B1.0, obtained from combining various surveys such as POSS-I, POSS-II and the AAO SERC southern survey. There is also a recent CCD catalogue, the UCAC, although with a brighter limiting magnitude
It should be stressed that the USNO catalogues
are not intended to be photometric catalogues, nor are they designed to give
precise photometry, although considerable effort has gone into their
photometric calibration which, at the bright end, is tied in to high-precision
photometry Tycho stars. However, provided that the limitations of the USNO
catalogues are known and understood, they are usable for photometric
applications.
Why use USNO A2.0? There are four basic
reasons:
· It is widely available.
- There
are many USNO stars in the field of view of the average comet. It covers a
very wide range of magnitudes to much fainter than the limiting magnitude
of any amateur CCD.
- It
is by far the best of the USNO products in the R band (superior in
accuracy to UCAC)
- There
isn’t anything better at present!
We have tested USNO A2.0 photometry against the IAC catalogue of high precision photometry of AGN fields in the Landolt system. This catalogue presents 22 000 observations over 75 nights in BVRI of 437 stars in 26 AGN fields, with a median accuracy »0.01 mags (see: Kidger et al.: 2004, New Astr. Rev., 48, 505, “A resource for multifrequency campaigns: a revised catalogue of UBVRIJHK calibration stars in AGN/blazar fields” for a description of the catalogue). The photometry was used to check the magnitudes in B, V, and R obtained from USNO photometry, where Astrometrica approximates the V magnitude from B and R as V=(3*B+5*R)/8.
The results are shown below where the USNO
magnitude is plotted against the IAC photometry for B, V and R. The diagonal
line is the line of photometric equivalence, where USNO “R” would be equivalent
to the standard R. Note that in R the points are distributed around the line of
equivalence, showing that the USNO A2.0 R magnitude is very close to the
standard R. In contrast, USNO A2.0 B magnitudes are systematically too bright
at the faint end of the magnitude scale, with an error of 0.8 magnitudes at
B=19.
In the following two plots, the detailed fits
for B and R are shown.
USNO “B” is
systematically too bright for stars fainter than B=13. An USNO B=19.2
corresponds to a true magnitude of B=20.
USNO “R” is very close to the Landolt/IAC “R” magnitude. At R=11, USNO is about 0.2 magnitudes too faint and at R=18 about 0.2 mags too bright. This though is within the margin of error on an observation. The USNO A2.0 photometry is, in this respect, far superior to USNO B1.0, for which the transformation to the standard R magnitude is much larger.
Although the USNO catalogue is not a photometric catalogue, the errors in its photometry are greatly exaggerated by non-users. Below we show the histogram of the measured errors on the magnitudes of stars.
Note that a few stars do have extremely large errors. However, after correcting for the transformation from USNO A2.0 R to the standard R, the median error on the magnitude is 0.197 magnitudes – i.e. 50% of all stars are this accurate, or better. This is also far superior to both USNO B1.0 and UCAC. The standard deviation of star magnitudes is 0.246 magnitudes (i.e. 67% of all stars have an error of this size or smaller). Such errors are comparable with the errors to be expected on CCD photometry of extended objects. Note that both Astrometrica and FOCAS clip stars that give highly discrepant photometry – these are not used in the magnitude determination.
If we look at the distribution of errors on USNO A2.0 R magnitudes, we find both good and bad news. The fraction of stars with accurate photometry is commendably high, a small proportion of stars though have extremely large errors, although a significant fraction of these may be variables.
|
Error |
Fraction |
|
<0.05
mags |
16.9% |
|
<0.15
mags |
39.4% |
|
<0.25
mags |
59.3% |
|
>0.5
mags |
11.0% |
|
>1 mag |
1.0% |
If we use USNO photometry sensibly then, it is
a valuable resource for comet and asteroid observers.
- NEVER calibrate against single
stars.
ü
Many
programs, such as Astrometrica and FOCAS, calibrate against all stars in the
field.
ü
Astrometrica
and FOCAS eliminate the stars that give discrepant photometry.
ü
As
a first approximation the uncertainty in the magnitude reduces as the square
root of the number of stars used.
- The biggest issue for observers
is sky subtraction, not the accuracy of star magnitudes.
Results
The typical error on a CCD observation is found
to be approximately 0.2 magnitudes. The biggest source of dispersion is
observers who fail to apply the standardised method correctly, with the most
common problem that of incorrect sky subtraction, although some CCDs also have
a sensitivity that more closely approximates to Johnson V than to R.
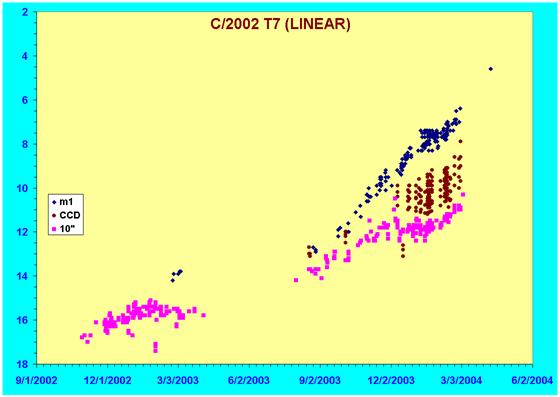
An example of results is shown below for C/2002
T7 (LINEAR) which shows the power of this method. The first plot shows the raw
light curve taken from data submitted to the “Observadores_cometas” mailing
list (Observadores_cometas@yahoogroups.com).
Data are split into estimates of the total visual magnitude – dark blue
rhombuses – CCD photometry with a 10” aperture – pink squares – and CCD
photometry with other apertures – brown circles. Note that there are some
outliers, although this are consistently due to the same few observers.
There is a disadvantage with the fixed aperture
method and that is that as the geocentric distance changes we are using a
variable physical aperture size, thus the amount of coma that enters in the
aperture is varying. Two approaches to this problem are possible.
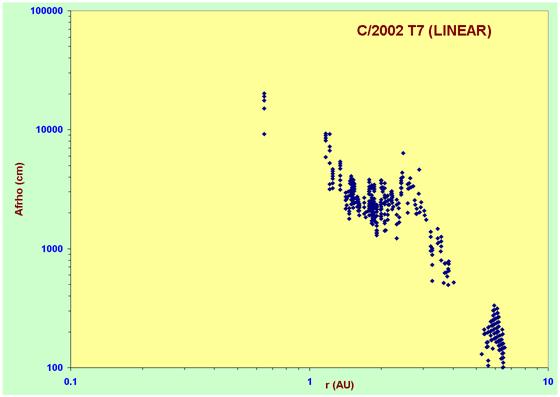
The simplest approach is to convert the photometry to an aperture-insensitive photometric measure. The best and most widely used one is the equivalent column of dust Afr in centimetres defined by A’Hearn et al. (1984, AJ, 97, 579). The conversion of the CCD photometry for all apertures to Afr is shown in the following plot. Note two large outbursts at r=2.7 and r=6AU, corresponding to 2003 December and February respectively. At perihelion, Afr » 20 000-cm, corresponding to a peak dust production of approximately 0.7 Halley.
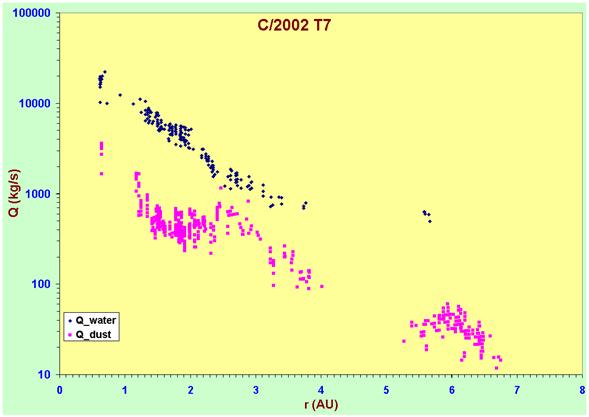
We can use the relationship defined by Osip et
al. (1992, Icarus, 98, 115) to covert Afr to the dust production rate. The
result is shown below. Peak dust production is approximately 3 tonnes/s,
compared with a peak water production of approximately 18 tonnes/s.
If the water content of the gases of C/2002 T7
(LINEAR) is the same as that for 1P/Halley – 71% by mass – the peak gas
production rate at perihelion for the comet was 25 tonnes/s (approximately 0.15
Halley) and the gas to dust ratio is approximately 8, implying that C/2002 T7
(LINEAR) is an unusually dusty comet, despite being dynamically new. This gas
to dust ratio should be compared to the value of 4.8 for the exceptionally
dusty C/1995 O1 (Hale-Bopp). However, at the peak of the outburst in December
2003, the gas to dust ratio was as low as 2.
The inconvenience of the fixed aperture size is
that using a single aperture gives no information about the coma profile apart
from having a variable physical size with Δ. Some Italian observers use
fixed physical sizes of aperture, but it is difficult to find appropriate sizes
for comets that have a large range of Δ as the size of aperture that is
appropriate for a comet at, say, r=7AU, becomes totally unmanageable when the
comet approaches the Earth to 0.5AU.
FOCAS allows photometry to be calculated in
several apertures for a single measurement. This allows coma profile
information to be obtained. You can then use the measured profile to calculate
the magnitude in any aperture and to unify CCD data with visual estimates, or
to calculate photometry for a fixed physical aperture from any data set.
However, in most cases we expect the coma to obey an r-1 law thus, if we define the coma index as:
R = log a + b log r
Where “R” is the magnitude in R with an
aperture of diameter “r” arcseconds, we expect to find that the coma index “b”
= -2.5, which is the result that is obtained in the majority of cases.
But for C/2002 V1 (NEAT) this approach did not
seem to work. The extrapolated CCD magnitudes were totally inconsistent with
the observed total visual magnitude estimates.
On investigation it was found that a
two-component fit to the coma was required, with an extended coma that followed
a different brightness distribution. For objects with such a large coma as
C/2002 V1 (NEAT) larger apertures (150 and 300”) were required to define the
coma brightness distribution. Note that a similar result was obtained over a
wide range of magnitudes and thus heliocentric distances during the apparition
(see below).
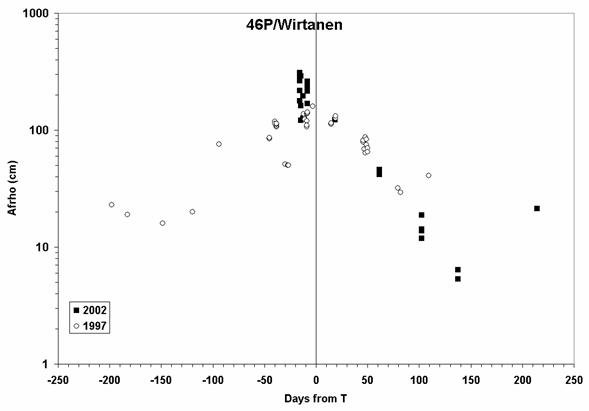
How reliable are the results obtained by the
photometric method described here? A comparison of the values of Afr obtained from dedicated professional
photometry of 46P/Wirtanen using narrow-band filters to isolate continuum
emission, taken during the 1997 return in support of the ROSETTA mission (open
circles) and unfiltered amateur photometry taken during the 2002 return (filled
squares) is shown in the final plot. Note that the agreement is excellent.
We thus conclude that the method described here
really can generate photometry of a good enough quality to be used in
professional research.
Conclusions
- With sensible rules one can
obtain very consistent CCD photometry of comets even with unfiltered
cameras and USNO A2.0.
- Custom programs such as FASE3
and its successor, FOCAS, written by Spanish amateur Julio Castellano and
now widely distributed permit easy astrometry and multiaperture
photometry.
- It has a good sky subtraction
and photometry algorithm adapted to real amateur data.
- This allows coma profile and
evolution information to be obtained with minimal effort.
The results for 46P/Wirtanen show that even
unfiltered amateur photometry can produce data on dust production rates of a
quality comparable to dedicated professional photometry in narrow band filters
if this method of taking photometry is carefully applied.