The Light Curve of 2008 TC3
On the night of the 2008 TC3
encounter several observers made long sequences of photometry of the asteroid.
MPC 213 and MPC J47 together have 285 internally consistent photometric
observations (i.e. reduced against the same reference stars) covering more than
66 minutes in total.
In the images of J47 it is obvious that the
asteroid is flashing regularly (i.e. the asteroid is irregular and rotating
quickly, as would be expected for such a small object).
The problem is to calculate the best fit to the
period from the data.
This is a very simple problem to resolve with
an Excel spreadsheet and a little trial and error, even without using
periodicity-fitting routines.
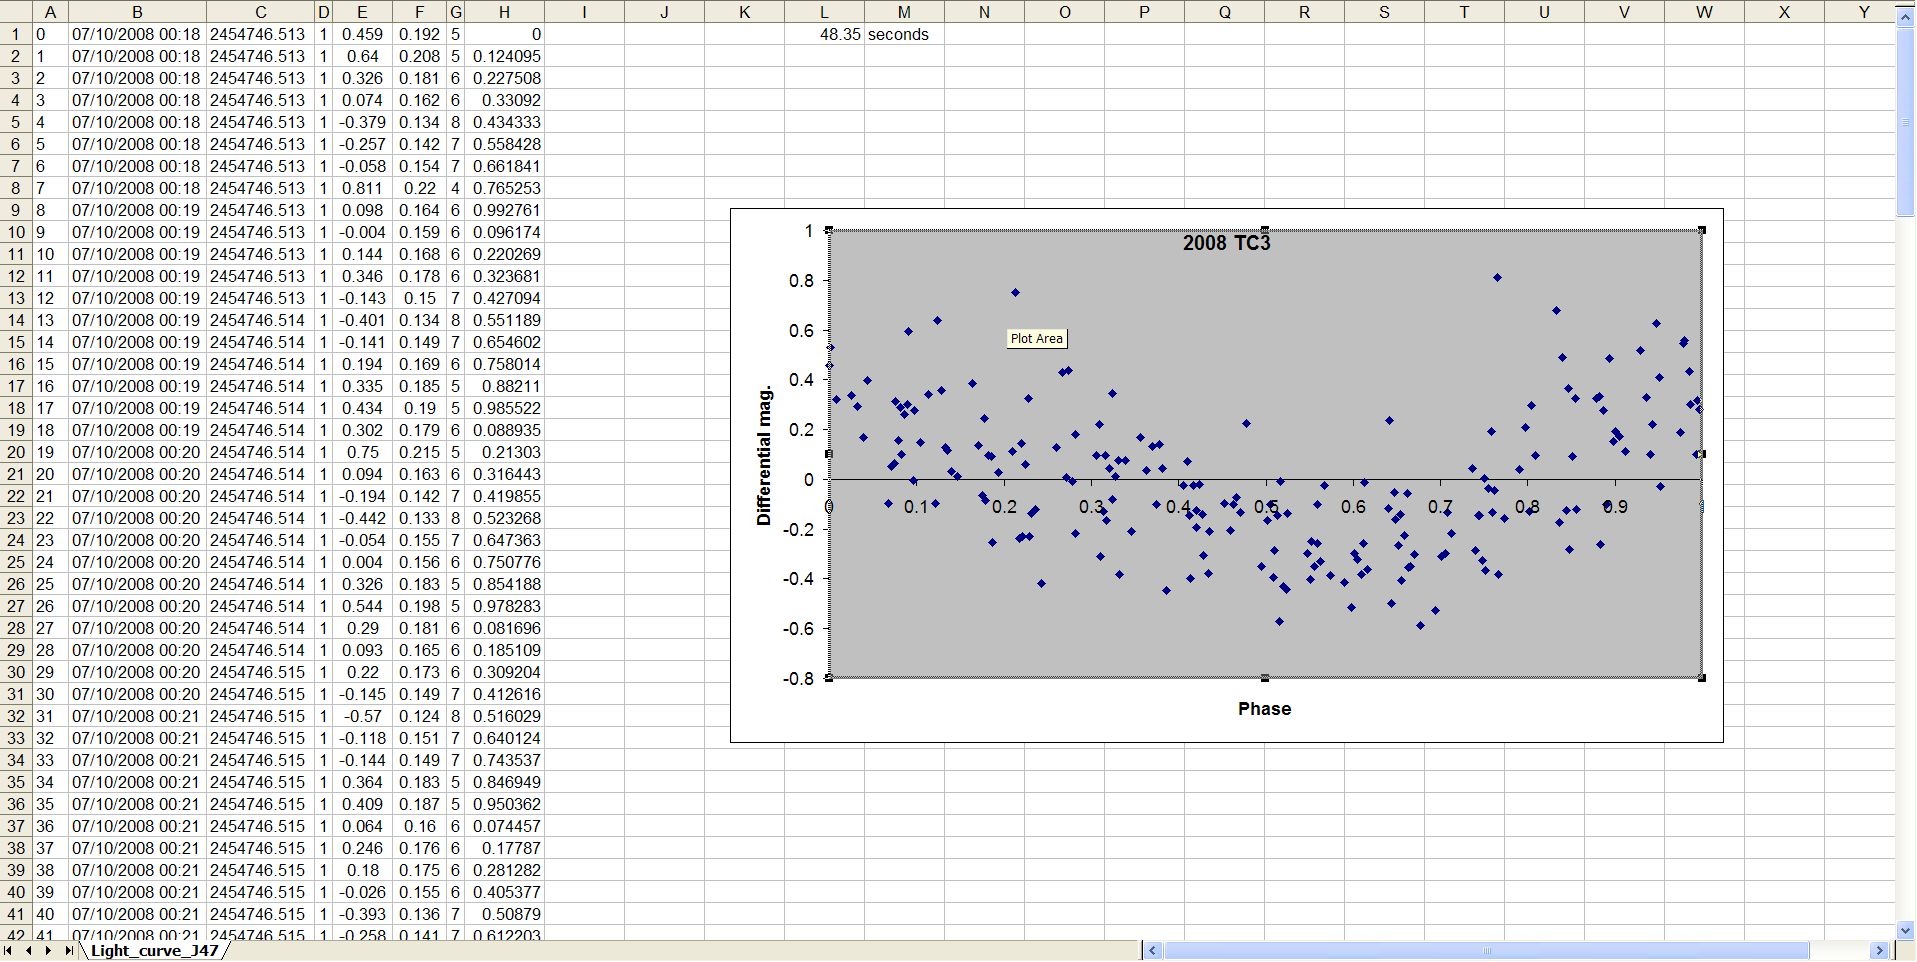
First you remove the trend in the data (2008
TC3 was brightening rapidly) and then you fit the data around a series of trial
periods, as shown below. This plot shows that the data from MPC 213 is a pretty
good fit to a period of 48.35 seconds, with a single maximum and minimum.
However, when you add in the data from MPC J47,
giving a much longer time base, you see that they are clearly out of phase. In
other words, however good 48.35 seconds looks over a short period of time, it
is not the best fit to the data, although quite close to it.
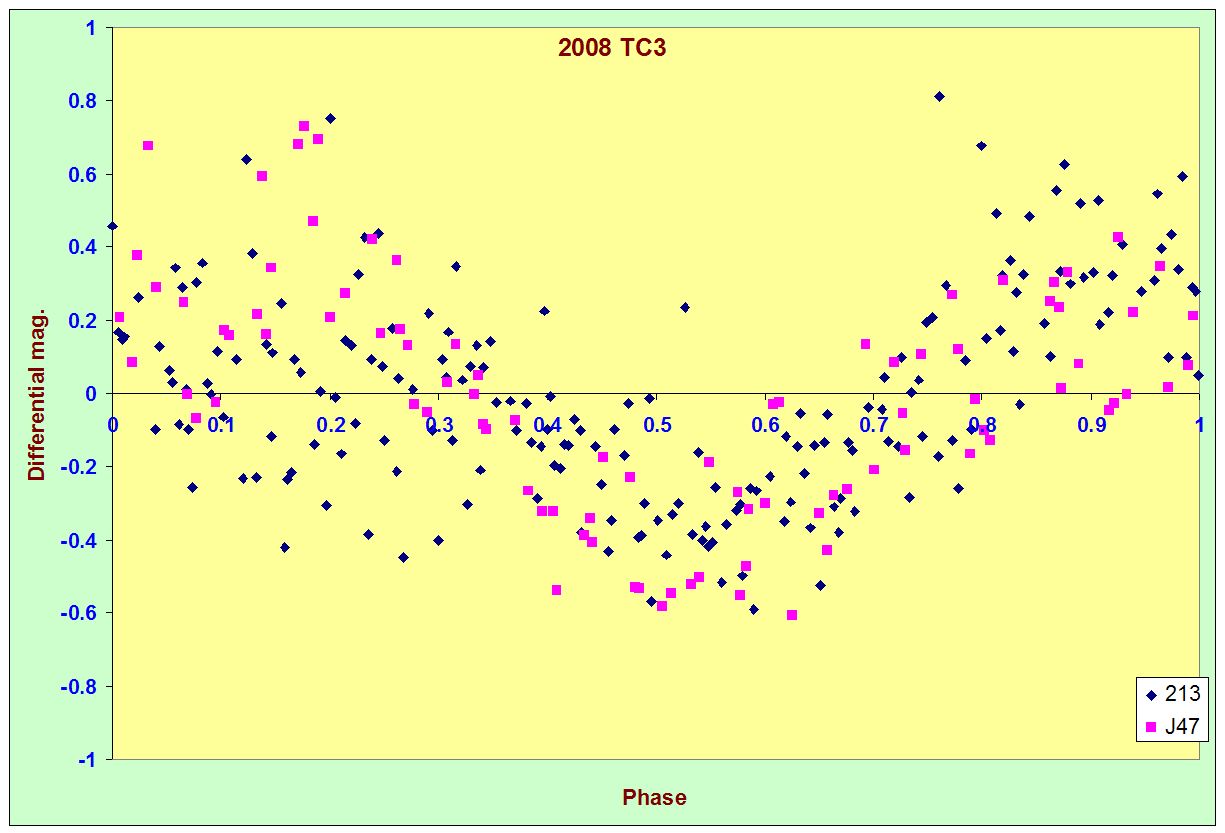
In fact, for a triaxial figure: that is, an
elongated object, you would expect two maxima and minima per rotation period.
When we try double the period: around 97s, we
find a nice light curve, with two maxima and minima per period. There is some
scatter in the data, but it must be remembered that the signal-to-noise ratio
per point was typically 8, giving a photometric error of around 0.14 magnitudes
on a single observation. In other words, we must expect a considerable scatter in the data.
The data is very sensitive to very small
changes in the trial period. Even a change of 0.05 seconds makes a visible
difference to the fit. By trying different periods we can find the best fit to
the data, reducing its scatter.
The best fit is found for a period of
97.13+/-0.03 seconds. The period is very sensitive to changes and, outside this
range, the fit to the data is clearly not so good.
The light curve shows a double maximum, with
amplitudes of 0.6 and 0.8 magnitudes for the two maxima, as shown below.
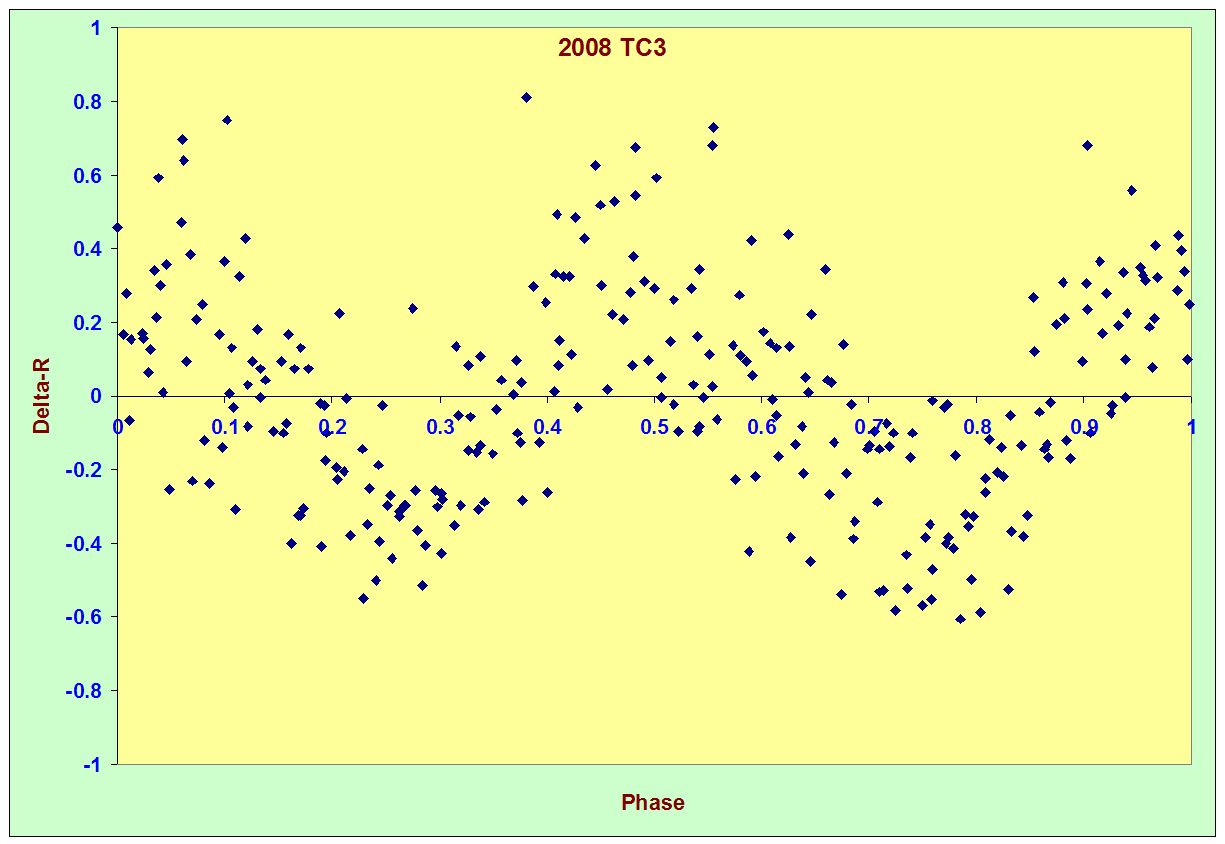
There are a few outlying points, but these can
be attributed to bad data on a night of occasionally variable conditions. The
data suggest that the asteroid had a strongly elongated shape.
We can look at how well the data from the two
stations fit this period individually. In the next plot data from MPC 213 are
shown in blue and from MPC J47 in magenta. The data agree very well with each
other, showing that they are nicely in phase and show the same amplitude over a
period of more than an hour.
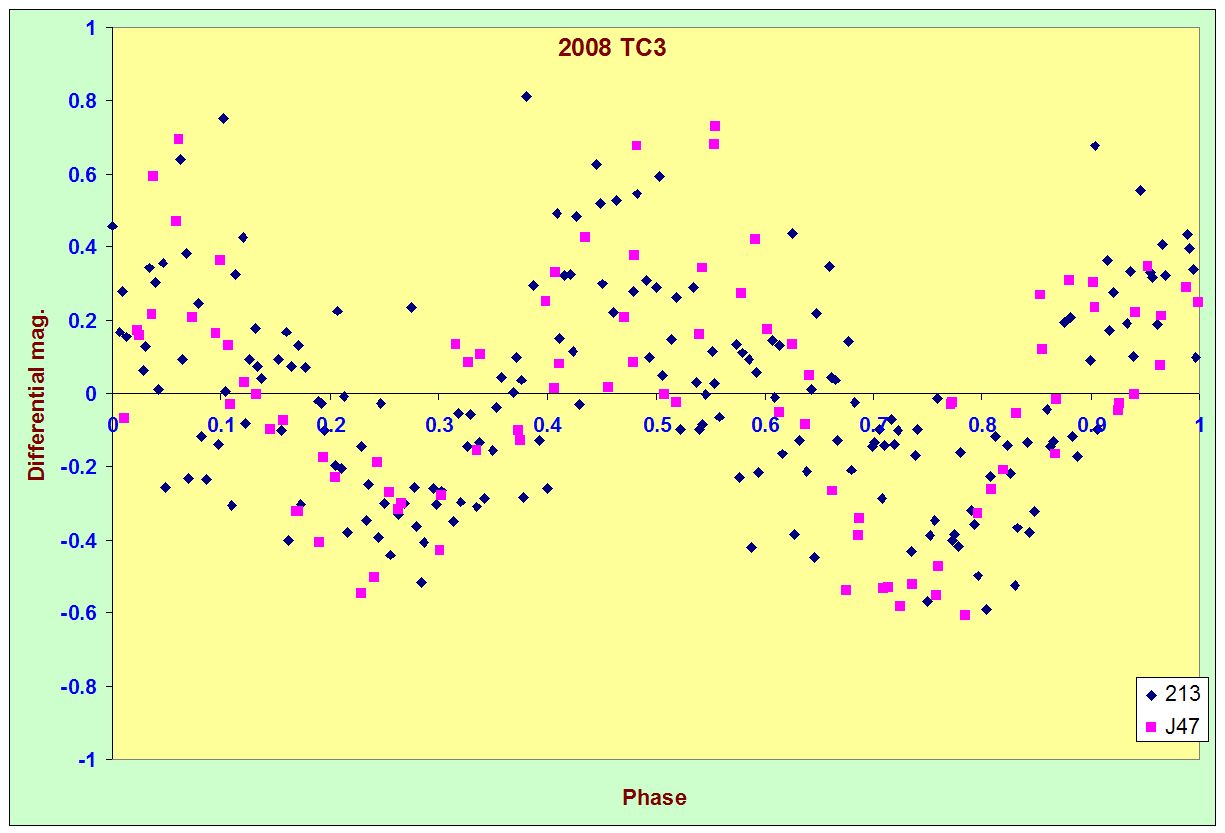
We can also look to see if there is actually a
good fit with a single maximum and minimum per rotation. This would be a period
of one half of 97.13 seconds. The data, fitted around a period of 48.62 seconds
show though that, although from phase 0.4 to 1.0 there is a good fit, the fit
is poor from phase 0 to 0.4 there is strong disagreement: this is what you
would expect from a light curve that shows two maxima and minima with different
amplitudes.
In this case there is clearly not a good
agreement between the two observatories over part of the light curve cycle and
this period of 48.62 seconds can probably be discounted in the light curve.