This text has been submitted for publication
to The Astronomer magazine and should be published in January 2004.
Prospects for C/2001 Q4
(NEAT) and C/2002 T7 (LINEAR)
Abstract
There is considerable
anticipation of the prospects of two bright naked eye comets – C/2001 Q4 (NEAT)
and C/2002 T7 (LINEAR) – being visible in Spring 2003. For observers in
northern hemisphere mid-latitudes there is even the unusual prospect of seeing
two bright comets in the same visual field in the evening sky. However, it must
be remembered that both are dynamically new (i.e. Oort
Cloud) objects and thus of a type that is well known for showing a falsely high
level of activity at large heliocentric distance due to being very gassy. It is
argued that of the two comets C/2001 Q4 is almost certainly a gassy object and
will be much fainter than expected on the basis of its activity at large
heliocentric distance, perhaps peaking at magnitude 4-5, but that C/2002 T7
appears dusty and offers good prospects of reaching a magnitude near +1 in
mid-May 2004.
Introduction
Both C/2001 Q4 (NEAT) and
C/2002 T7 (LINEAR) were discovered at rather large heliocentric distance
(r=9.9AU and r=6.92AU respectively). On the basis of their brightness at
discovery and relatively close approaches to the Earth in May 2003 (C/2001 Q4: Dmin=0.321AU, 48 million kilometres on 2003 May 7th,
at T-9 days; C/2002 T7: Dmin=0.266AU, 40 million kilometres on 2003 May
18th, at T+27 days with the comet still well inside the Earth’s
orbit after perihelion at 0.615AU) there were early suggestions that the comets
could reach naked-eye visibility in 2004 April-June. There was even a
suggestion that the CONTOUR mission could be redirected to an encounter with
C/2001 Q4 given that this object appeared to have an absolute magnitude 1.5
magnitudes brighter than C/2002 T7 and thus be of Halley class.
C/2002 T7’s orbit is found
to be weakly hyperbolic (e=1.000519 at perihelion) and opening further while in
the inner solar system. C/2001 Q4’s orbit is also weakly hyperbolic at
perihelion (e=1.000752) and opening. In other words both are dynamically new
and thus Oort Cloud objects.
Standardising the light curve
When analysing the light
curve it is necessary to take care to separate CCD magnitudes, often of only
the innermost coma, and total visual magnitude estimates. CCD data is taken
with a wide variety of methods and apertures and should be standardised if it
is to be meaningful and to be employed usefully. For example, Yoshida (http://www.aerith.net/comet/catalog/2002T7/2002T7.html) groups both visual and CCD data and fails
to make the significant correction of magnitudes from R to V. Increasingly, CCD
observers are using a method involving use of a standard aperture size of 10 arcseconds (see Kidger, M.R.:
2003, A&A, 408, 767), care though must be taken to subtract the sky well
away from the comet to avoid coma contamination of the sky background. This method allows far greater significance
to be made of amateur CCD photometry.
Photometry calculated using
USNO A2.0 “R” magnitudes may be converted to the standard Kron-Cousins
“R” magnitude (note that the USNO B1.0 magnitudes have a far larger correction
and greater errors on the photometry, although the USNO B1.0 astrometry is
better) by the relation:
RK-C =
0.993 RUSNO A2.0 + 0.066
We can then use this
normalised magnitude to calculate the light curve parameters. One of the most
useful values is Afr, measured in
centimetres. This is the product of the dust albedo
and filling factor and can be visualised as the equivalent column of dust
summed through the coma.
Afr = e(2 ln(D+r) - ln r + ln r) - (MQ+m)/1.086 + 50.546)
Afr is measure of the
level of dust emission and thus the level of activity of a comet. Note that in
B and V the dust contribution is usually contaminated by gaseous emission and
will not give accurate results. To see it in context, a fairly low activity
object such as the ROSETTA target, 67P/Churyumov-Gerasimenko, had a value of
approximately 130-cm at perihelion and some 300-cm at the peak of its outburst
in 2002 October. In contrast, 1P/Halley gave peak values of »25000-cm in 1986.
For C/2002 T7 (LINEAR) the value of »80-cm at discovery has risen to »3000-cm in
mid-December 2003, although still at r=2.4AU.
The light curves
C/2001 Q4 (NEAT): This comet is still in the southern polar
region in January 2004 and has been heavily underobserved.
35 CCD and 13 visual observations are used here.
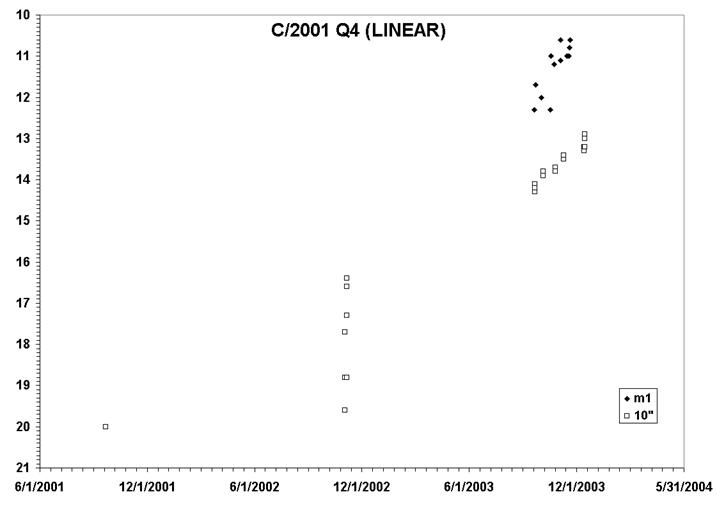
The light curve of C/2001 Q4 (NEAT). The CCD data is from MPC stations 620, 859
and I30. Total visual magnitude estimates from Alexandre
Amorim and William Souza.
The small quantity of data
makes analysis difficult. The light curve shows a rapid rise of both the total
visual magnitude and the CCD magnitude in a 10 arcsecond
aperture, in part due to the comet’s rapid approach to perihelion. The light
curve gives a best fit, over a rather limited range of heliocentric distance,
of:
m1 = 3.3 + 5
log D + 11.5 log r
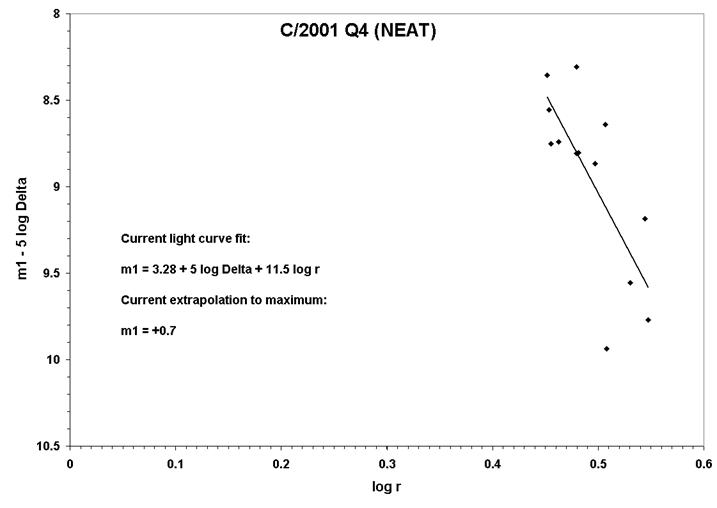
The total visual magnitude of C/2001 Q4 (NEAT) against the logarithm of
heliocentric distance. Note the huge extrapolation that must be made to predict the magnitude
at perihelion (approximately at the position of the y-axis), thus such
predictions are highly unreliable at present, particularly if the rate of
brightening slows closer to perihelion.
The values of dust
production show Afr » 850-cm at
mid-December 2003 and hence the dust production rate Qd
» 160 kg/s at r=2.54AU. Dust production has though
barely increased since 3.5AU. Combined with the rather fast visual brightening
this suggests that the object is a very gassy comet that will have a rather
small dust production rate at perihelion and will be a typical “disappointing”
comet.
C/2002 T7 (LINEAR): In contrast to C/2001 Q4 this comet has
been very heavily observed with 71 total visual magnitude estimates by 8
observers and 362 CCD magnitudes measured in a 10 arcsecond
aperture. The light curve is shown below, separated by observer. Initially the
coma was very condensed and the difference between CCD and visual estimates
relatively small. As the coma has developed though the
difference is becoming increasingly large.
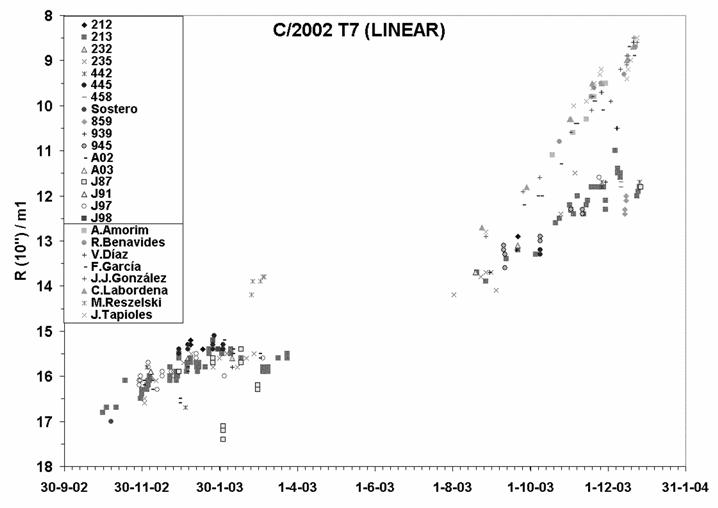
The light curve of C/2002 T7 (LINEAR) with data identified by observer.
An interesting aspect of
the light curve is the two large steps that show a significant decline in
activity: one in February 2003 and another very brusque one in mid-December in
which dust production halved in a week or less. In between there was a rapid
recovery of activity and the most recent data suggests that dust production is
already recovering very quickly. The peak dust production before the decline
was Afr » 4000-cm,
approximately equivalent to Qd = 800kg/s,
a respectable quantity even for a typical comet at perihelion.
The light curve fit to the
total visual magnitude estimates is:
m1 = 4.23 +
5 log D + 10.1 log r
Giving an extrapolation to
perigee of m1= +0.5. An interesting facet of the activity is how, in
contrast to the average “new” comet, it brightened slowly initially and then
much more rapidly closer in to the Sun.
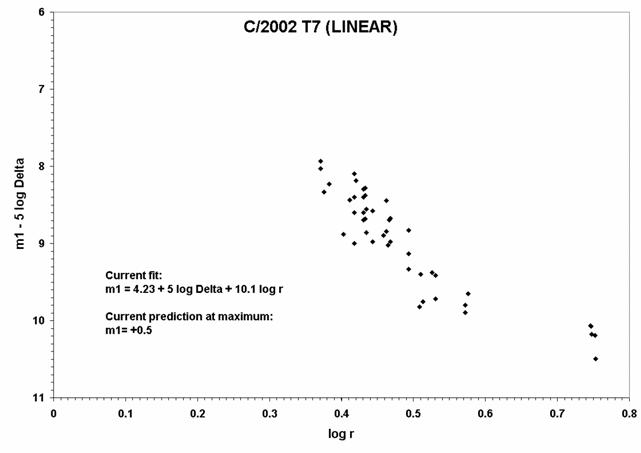
The visual light curve of C/2002 T7 (LINEAR) against the logarithm of
heliocentric distance. Note how the rate of increase of brightness is faster now than at large
heliocentric distance.
Comparing C/2001 Q4 (NEAT)
and C/2002 T7 (LINEAR)
It is interesting to
compare the data for the two comets directly. C/2001 Q4 has a brighter absolute
magnitude at present and has generally been considered the larger and more
important object, but C/2002 T7 has a smaller perihelion distance and will
approach the Earth closer. A comparison of the visual and CCD data offers some
important clues about the nature of the two comets.
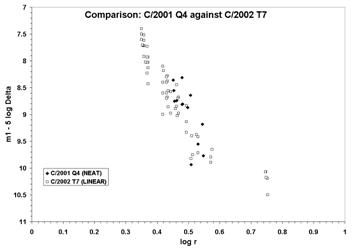
It is important to remember
that visual data is more sensitive to the blue (gas) component of cometary light, while CCD data registers the red continuum
(dust) component better. In both plots the solid symbols are data for C/2001 Q4
(NEAT) and the open symbols data for C/2002 T7 (LINEAR). In the left hand plot
we see that at the same heliocentric distance C/2001 Q4 is visually at least
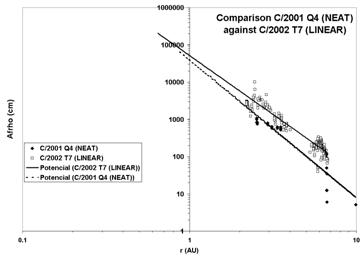
half a magnitude brighter at the same heliocentric distance. In the right hand
plot though we see that C/2002 T7 (LINEAR) has approximately double the dust
production at the same heliocentric distance; we also see that, extrapolated to
perihelion, the dust production of C/2002 T7 is about 4 times higher than for
C/2001 Q4.
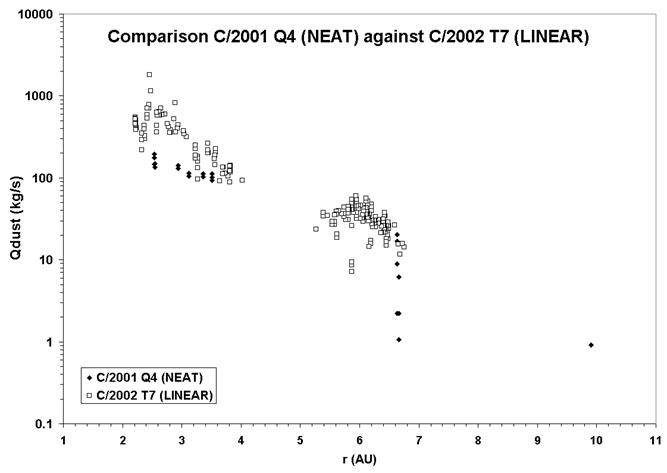
The dust production
of C/2001 Q4 (NEAT) compared to C/2002 T7 (LINEAR) as a function of heliocentric
distance. The latter comet has consistently had a dust production rate double
that of the former.
The interpretation of this
result is that C/2001 Q4 is a much more gassy comet
than C/2002 T7. We could estimate that the dust to gas ratio is of the order of
4 times higher in C/2002 T7. As the brightness of a comet close to the Sun is
strongly proportional to its dust production it is not unreasonable to expect
what is nominally the fainter comet at present (C/2002 T7) to be much the
brighter of the two at perihelion. Historically, most Oort
Cloud comets that have shown strong activity at large
heliocentric distance have been very disappointing at perihelion. The one
notable exception was C/1956 R1 (Arend-Roland) which
had an open orbit somewhat similar in characteristics to C/2002 T7 and which
reached magnitude +1, with a 30º tail in April 1957. It is not insignificant
that Comet Arend-Roland was an unusually dusty Oort Cloud object. We can thus
expect C/2001 Q4 to brighten very much more slowly closer to the Sun – the
recent slow-down in the increase of dust activity in this comet is probably the
first symptom of a slow-down in activity – whereas C/2002 T7 should continue to
brighten at a similar rate to the present one.